White paper introduction
LoRaWANTM provides a positioning solution for low-power WANs, providing the location information needed for a range of battery-powered application terminals. Any working LoRaWAN terminal supports location functionality without the need to add additional BOM costs and does not require additional processing power.
Suitable group
The readers of this white paper are LoRaWAN service providers, enterprise and terminal equipment manufacturers that intend to develop positioning function applications. This article will describe the technical points of LoRaWAN positioning, highlighting application cases suitable for LoRaWAN positioning, and providing several deployed research cases.
Comparison of positioning technology
LoRaWAN TDOA/RSSI
• The lowest cost solution, any LoRaWAN terminal is born;
• LoRaWAN supports cases of long battery life applications;
• TDOA: Positional accuracy of 20-200m depending on the situation;
• RSSI: 1000-2000m positioning accuracy;
WiFi positioning
• Efficient solutions for indoor and outdoor positioning
• Accuracy increases as hotspot density increases
BLE
• Requires BLE beacon system
• Indoor positioning solution
GPS/AGPS
• A GPS BOM cost is $5-10
• The most accurate but most power-hungry solution
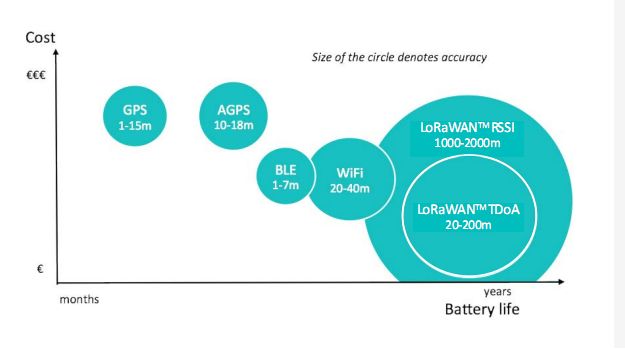
(Figure 3.1 Comparison of positioning technology)
The above picture visually shows the comparison of several positioning technology costs, accuracy, power consumption and so on.
As shown in the figure above, the LoRaWAN protocol provides two positioning methods: positioning based on received signal strength indication (RSSI) for coarse positioning and time difference of arrival (TDOA) positioning for precise positioning. This article will discuss TDOA positioning because it is more suitable for scenarios that require low-power, battery-powered devices with positioning accuracy ranging from 20-200 meters.
Suburban deployments with clear line of sight and recommended gateway deployment strategies will achieve high accuracy at low deployment scales. Multipath problems in cities and dense urban environments will affect positioning accuracy. Therefore, in general, the positioning accuracy will increase as the density of the gateway network increases.
In general, terminals that do not require frequent positioning can achieve optimal power efficiency. These devices are typically set to Class A terminals that are fixed or infrequently moved.
The location information of these terminals does not require additional hardware costs. Mobile terminals require more frequent location information, they transmit more data frames, consume more power, and increase hardware costs (such as batteries). These terminals are usually set to Class B or Class C. Using a higher data rate (such as SF7) helps limit the increased power requirements.
The focus of this paper is on outdoor and wide-area positioning. It should be noted that various solutions are being used within the LoRaWAN circle to provide indoor accuracy of 10 meters or better positioning accuracy (gateway density of 100 meters, improved clock source, etc.). This can be compared to the indoor WiFi arrival angle (AOA) positioning technology with a positioning accuracy of 1-3 meters.
LoRaWAN positioning capability
This section provides a theoretical overview of LoRaWAN TDOA positioning and impact accuracy errors.
1
Architecture
When the uplink data of a LoRaWAN terminal is received by three or more base stations, it can be located. These upstream data do not need to be specific location information, they can be a common LoRaWAN data frame structure. When multiple base stations receive the same uplink data at the same time, the location information of the terminal can be obtained by multi-point positioning technology. The figure below is a schematic diagram of the process of multipoint positioning.
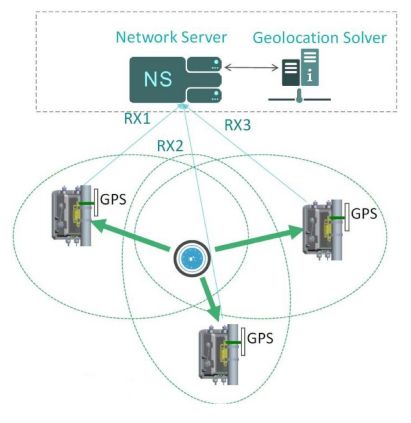
(Figure 4.1 Positioning Architecture Diagram)
No additional hardware support is needed here. But the base station does need precise time synchronization, which is currently achieved by GPS inside the base station (or any means that can synchronize with the base station clock in tens of nanoseconds). Each received upstream frame will get the exact timestamp of the gateway. This timestamp will be forwarded to the web server as part of the frame structure, which also includes signal level, signal to noise ratio and frequency error.
The web server will sort multiple receipts of the same data frame, group all metadata containing the timestamp of the frame data, and request a positioning calculation from the positioning solver. In a given frame structure, the basic positioning solution function will calculate the time difference received by different base stations, and then the time difference can be used to measure the distance of the terminal equipment to different base stations.
Once the TDOA of the two base stations is known, the location of the terminal can be placed in a hyperbola. Through the calculation of multiple time differences, the position information of the terminal can be presented on multiple hyperbolas, and finally the position of the terminal should be at the intersection of these hyperbolas.
The accuracy of positioning is related to several factors:
Communication environment and path
Gateway deployment strategy and density
Algorithm for positioning
Gateway time synchronization accuracy
Terminal device dynamics and structure
2
Influence of propagation error
In a multipath environment, the performance of LoRaWAN positioning is limited by the accuracy of the gateway clock. When the sensitivity of the signal is 25dB, the positioning test can usually achieve an accuracy of more than 3m. At the sensitivity level, noise can reduce accuracy to 60m.
Under these constraints, accuracy is rarely dependent on the received signal level. In the case of multipath, since the system bandwidth is limited to 125 KHz, the signal path is usually difficult to distinguish, and only the average channel delay can be estimated. In some cases, the direct signal path does not exist, and since the reflection path is only visible, the delay offset is introduced into the frame timestamp.
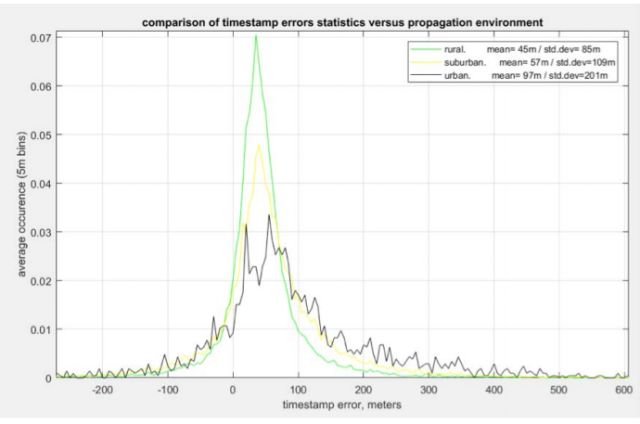
(Figure 4.2 Statistics of timestamp error)
Figure 4-2 shows statistics of timestamp errors for different propagation scenarios. These measurements are obtained from mobile vehicle testing and GPS estimates the time stamp error. The urban scene is less than other scene data points (2000 vs. 10000), which explains why the curve representing the city grows "more ugly". The average distance from the vehicle to the gateway is 1.5km.
In general, timestamps are always lagging. Note that timestamp errors may be negative, but they will never be less than -1/bandwidth (never below the system's base resolution). We can use the bias to classify the time stamp error, which is the average error and propagates around this average. As the propagation environment is harsh, the deviation increases and the propagation becomes wider.
There are several ways to reduce the timestamp error:
• Repeat frames at different frequencies
• Increase the antenna of the base station (usually two)
• Increase the density of gateway deployments to increase the number of available samples and the opportunity for line-of-sight measurements to improve the accuracy of TDOA
• Reduce the timestamp of the base station's delayed frame
• Introduce out-of-band propagation error correction to mitigate multipath (simulation, prediction, calibration or fingerprinting)
The purpose of the positioning solver is to reduce multipath. The solver will select the set of queues for the timestamp to process, ignoring the rest. Then the solver obtains the position of the terminal device by solving the data. Multipath propagation fundamentally limits the accuracy of the system, but base station deployment strategies also play an important role.
3
Impact of deployment strategy
Like other radio systems (eg GPS, LORAN), the accuracy of LoRaWAN positioning depends on the location relationship of the gateway and the terminal device. The metric used to determine the quality of the gateway deployment is the Geometric Dilution Of Precision (GDOP), which is a measure of the "advantage" of the relative geometry of the receiving gateway.
Each time the difference calculated by the positioning solver defines a hyperbolic curve. The hyperbola is an open curve, so when the terminal device is in an inappropriate position relative to the base station, the intersection of the hyperbola causes an error amplification.
The GDOP can capture the amplification factor of this error, which depends only on the geometric positional relationship between the base station and the terminal equipment. For positioning in 2D coordinates, we introduce horizontal DOP (HDOP, horizontal accuracy factor). When HDOP is 1, it means there is no error amplification; if the base station shows a timestamp of 60m (ie 200ns) uncertainty, then the final positioning uncertainty is 60m. When HDOP is 2, the final uncertainty is 120m. When the base station deployment density is high, HDOP can also be lower than 1.
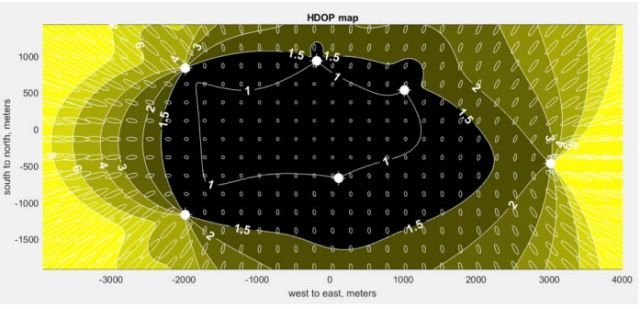
(Fig. 4.3 HDOP map)
Figure 4-3 simulates a HDOP map of six base station deployments. The dot in the figure represents the gateway, and the contour area is the HDOP display area.
In the middle zone, HDOP is greater than 1 and increases all the way to greater than 8. In areas outside the polygons made up of gateways, HDOP grows very fast. The high HDOP greatly reduces the accuracy of positioning.
The white uncertainty region in the conventional space describes both the amplitude of the position error and the direction of the error (pointing radially toward the center of the polygon). Please note that on the east side of the map, even in the gateway polygon area, HDOP will reach 2 along the north-south axis with a large error. This is due to the lower density of the gateway along the axis.
It should be mentioned here that the closer the location of the base station is, the better the positioning effect is; the most important is the base station location layout strategy. Compared with the middle of the rectangle, the positioning accuracy in the middle of the square formed by the four gateways is better.
Poor performance outside of the overlay polygon should be a problem with the deployment strategy. Therefore, for small-scale or pilot positioning deployment, it is strongly recommended to introduce HDOP and optimize gateway location selection.
4
Time error
The reception quality of GPS also affects accuracy. For mobile service providers, base stations close to cell sites may experience periodic GPS blockages, so special antennas must be used.
Base stations installed on low roofs or billboards in cities are also affected by the "urban canyon" effect of fewer satellites. When the GPS reception quality is good, the time base error is approximately 25ns (<10m). GPS is not the main source of error because deployment accuracy cannot reach 10m. However, in a very densely deployed LoRaWAN network, increasing the accuracy of the gateway clock can further improve the accuracy of positioning.
5
Filtering improves positioning accuracy
Depending on the application, the output of the positioning solver can be filtered for better accuracy. For example, if the terminal device position is known to be fixed, the solution time average can be used to derive the position. Kalman filtering is a versatile technique for estimating position and velocity from noise observations (most positioning systems use the Kalman model).
Returning to LoRaWAN positioning, since the pre-filtered position estimate is sparse and noisy, filtering has a large impact on positioning performance. If the filter can utilize the speed profile of a particular terminal device, the accuracy of the positioning can be improved. These configuration information is derived from the terminal itself (fixed, mobile, etc.) and is directed by a particular application.
Another use of a particular application is matched filtering. For example, if the terminal device moves between warehouses, the filter first divides the terminal device into stationary or mobile. If it is static, you can assume it is in a repository. If it is moving, it is on a path.
For low power optimization, the LoRaWAN duty cycle is limited in some areas, so that the terminal can only transmit a limited number of frames per day. This limitation is an aspect of LoRaWAN communication limitations and is not specific to location scenarios. Devices that are fixed in practice are easier to locate than motion because some frame data can be more easily utilized to filter position estimates.
Deployment case study
1
Port of Barcelona (Actility/Cisco)
An example of LoRaWAN positioning is vehicle positioning. GPS has been used to locate vehicles for many years. However, due to the complexity and cost of installation, it has not been widely pushed. Since GPS positioning is very power hungry, it needs to be connected to the battery. Now based on LoRaWAN TDOA positioning, it is a new generation of low power positioning solutions that are already available.
At the Mobile World Congress in 2017, Actility and Cisco installed six IR829/IXM LoRaWAN gateways in ZAL Port to implement dedicated LoRaWAN network coverage in ZAL Port. The ZAL Management System provides security, operations and day-to-day services to companies in the port.
The network covers an area of ​​0.43 square kilometers in the port, and the six gateways are spaced 400 to 600 meters to ensure good network coverage. There is no high point in the three-story metal building area where the antenna can be placed, so the antenna is mounted directly on the roof (sub-optimal configuration).
The Abeeway positioning terminal is installed on the management vehicle. Positioning the terminal in LoRaWAN TDOA mode is the most energy efficient positioning method. If there are few considerations on power consumption, using LoRaWAN uplink to assist GPS reporting positioning data can be used for scenes requiring higher precision (accuracy within 10m).
The LoRaWAN positioning terminal saves more than 50% of the power compared to a typical AGPS/GSM positioning terminal. And because it is battery-powered and does not require other power supplies, the terminal is easy to install and can be fixed to the vehicle with glue, screws or other simple means. At the same time, the APP is used to monitor the online vehicle operation of ZAL port in real time.
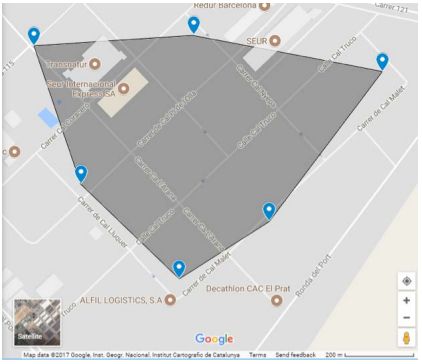
(Figure 5.1 Location of Barcelona ZAL Port Base Station)
In the case of the ZAL port, the application calculates the time each vehicle spends passing through each building (eg, how long it has stopped). The buildings in the logistics area are usually sparse, the location where the vehicles are parked is more than 80 meters from the building, and most vehicles are parked between 20 minutes and 12 hours. Tracking of parked vehicles is a major application of TDOA positioning. Positioning terminals report position information every 10 minutes, and can obtain positioning accuracy of 60-80m. When the vehicle is stationary, the positioning solver averages the data of multiple frames and can be monitored in time when the vehicle starts moving again. Figure 5-2 shows the positional accuracy of a fixed vehicle.
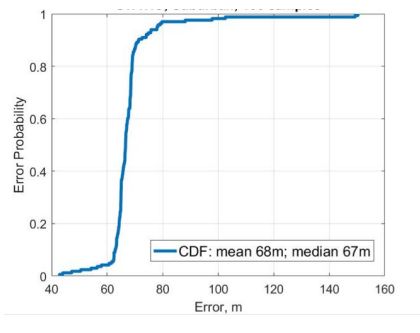
(Figure 5.2 ZAL port TDOA positioning accuracy: fixed vehicles)
The approximate real-time location of the moving vehicle can also be located via TDOA. The average accuracy that can be located by our test for a moving vehicle is 171 meters. This is enough to determine the general direction of the vehicle to see if it is heading to the next location or to return to the parking spot after the end of the day.
In this case, the positioning accuracy is not that important, because the positioning information is mainly used here to trigger the alarm when the vehicle enters and exits the designated area. Figure 5-3 shows the positioning accuracy of a moving vehicle.
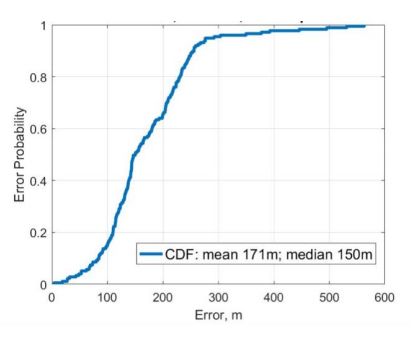
(Fig. 5.3 ZAL port TDOA positioning accuracy: moving vehicles)
2
Ixelle Mulino/Brunn (Actility/Cisco)
Cisco and Actility deployed five IXM LoRaWAN gateways in the Paris area to verify LoRaWAN positioning capabilities. The network covers the urban areas of Isilé Mulino and Buren. The base station uses Ethernet or mobile network for data backhaul, the test system runs 24 hours, and the stationary and mobile test nodes can generate messages for locating application development.
The network coverage area is approximately 1.6 square kilometers, and the four base stations are spaced from 900 meters to 1300 meters, forming a pentagonal area. The fifth base station deployed in Buren will be used in future tests. The area includes commercial, municipal and residential, as well as more open land such as the Seine, parks and stadiums. The antenna is mounted at a height of 60m to 126m.
High-point deployments (shown in Figure 5-4) provide long-distance coverage, but ground coverage is sometimes affected. Due to the mountainous terrain, it is necessary to increase the deployment of the base station to ensure the best positioning capability (the data of each positioning terminal must be received by at least three base stations).
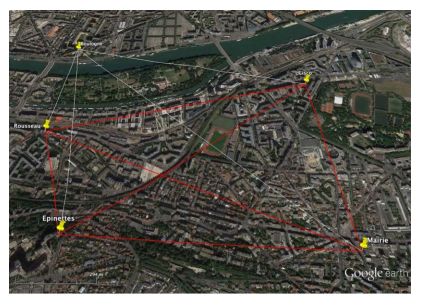
(Figure 5.4 schematic diagram of the deployment of Isilie Mulino / Buren Gateway)
Fixed asset positioning is performed using the Adeunis V2 test equipment, and uplink data is sent every 20 seconds. Every eight upstream data constitutes a positioning "frame". The positioning terminal is configured with a "fixed" configuration file that supports adaptive data rates.
In the area formed by the interconnection of the gateways (the HDOP is better), the positioning accuracy can reach 75-115 m (approximate standard deviation is 25 m). At the periphery of the area, the positioning accuracy is 400m (the HDOP is poor). These results are consistent with the test findings at the ZAL port in Barcelona. Figure 5-5 provides a typical positioning map. Other gateway deployment strategies, fixed and mobile terminal testing are still in progress.
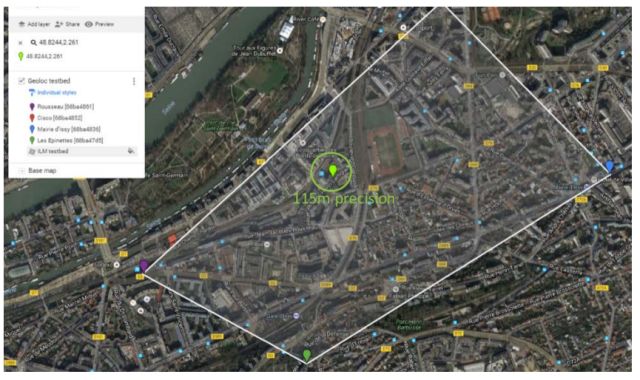
(Figure 5.5 Paris positioning case diagram)
3
Neuchâtel (Semtech)
Semtech is conducting LoRaWAN positioning tests in the urban environment of Neuchâtel, Switzerland. The city is situated between a lake and a mountain and has many hills. So from the perspective of GDOP, this is a difficult case. Because of the mountainousness, it will bring long delays. Six base stations and 30 fixed outdoor test points are indicated in Figure 5-6.
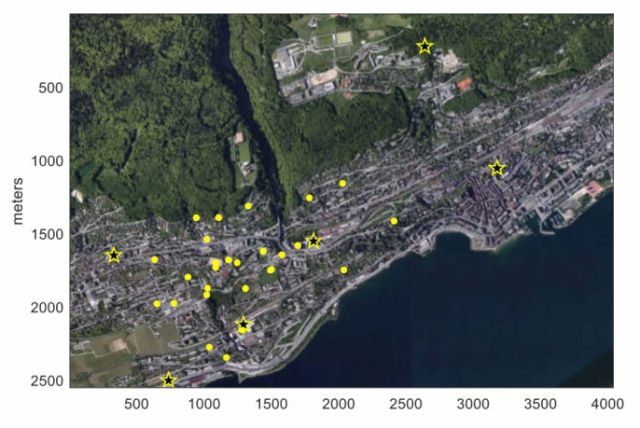
(Figure 5.6 Schematic diagram of Neuchatel positioning example)
Figure 5-7 shows the cumulative distribution function for the positioning performance of different numbers of LoRaWAN frames received from 30 test points. The average positioning accuracy in a single frame is about 150 meters, and the accuracy of 8 frames is increased to 80 meters. No filtering is used here.
Multiple sets of tests were performed at different data rates: SF7, SF10 and SF12. Their performance is identical, indicating that multipathing and GDOP are the main factors affecting performance. The worse the GDOP, the worse the positioning performance: at 8 frames, 90% of the positioning accuracy is only 205 meters.
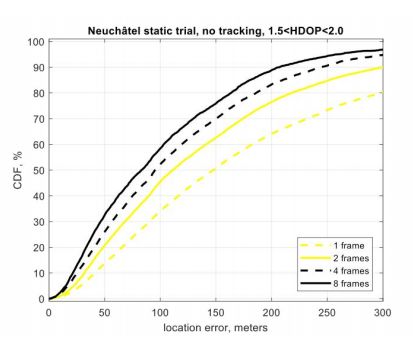
(Figure 5.7 Neuchatel positioning performance chart)
4
Mkomazi National Park (Semtech/Kerlink)
Internet Life and the ShadowView Foundation are developing trackers based on LoRaWAN to protect endangered black rhinos in the Mkomazi National Park Reserve in Tanzania, with technical support from Semtech and Kerlink. The GPS-free LoRaWAN trackers are smaller, cheaper, consume less power, and are not affected by poachers equipped with GPS jammers, and they can report geolocation more frequently than GPS trackers.
In September last year, the first LoRaWAN tracker was implanted with a rhinoceros horn of a rhinoceros, and the security personnel of the park operated it to locate and monitor the rhinoceros.
The Rhino Protector is a fenced area of ​​50 square kilometers. Four Kerlink gateways that support positioning have been deployed to implement LoRaWAN coverage in the area. The distance between the gates is between 4 and 10 km. The positioning accuracy exceeds 50m, and in some cases exceeds 20m.

(Figure 5.8 Mkomaqi positioning pilot diagram (four frames))
Figure 5-8 shows an example of rhino positioning, using four frames per point to calculate a position. The average error in the first two figures is 40m, and the corresponding test point is in an area where the HDOP is higher than 2. The HDOP in the third figure is 1.5. The exact location of the test points and gateways here cannot be made public. The intra-area network will perform better HDOP optimization, and the network deployment in other areas of the natural park has also been completed.
Other smart applications being used by park management include solar trackers installed on vehicles to track the movement of people and tourists in high-risk areas. Figure 5-9 shows the results of a single frame alignment with an accuracy of more than 50 meters, but more than four frames.

(Figure 5.9 Mkomaqi positioning pilot diagram (single frame))
5
Bouygues Building (Objenious/Sagemcom)
Construction logistics, fleet management and waste management are all potential markets for the Internet of Things. Objenious and Sagemcom jointly developed the Ubysol solution for Bouygues, providing tracking of construction waste as it transports goods between loading and unloading points.
The Ubysol solution supports the “Greater Paris†regional master plan, which aims to transform the city of Paris (the city of Paris and the surrounding 130 suburbs, communities) into a 21st century city. It is estimated that the project will generate more than 43 million tons of construction waste. Each truck is equipped with a SiconiaTM multi-sensor terminal. The data transmission of the terminal device is triggered by the motion sensor and uses a gyroscope to detect loading and unloading.
In order to benchmark the LoRaWAN positioning, some trucks also have GPS sensors installed. The path of GPS and LoRaWAN positioning is compared, as shown in Figure 5-10, the two paths are in good agreement.
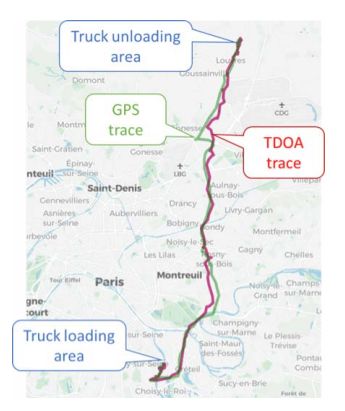
(Figure 5.10 GPS, LoRaWAN TDOA positioning path comparison)
The statistical performance (CDF) is collected over several months, and the positioning performance results of the Ubysol solution are shown in Figure 5-11. Achieve an average positioning accuracy of 136m.
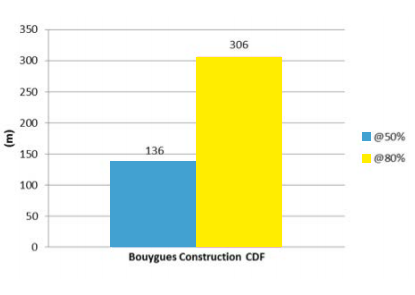
(Figure 5.11 Ubysol solution accuracy statistics)
6
Paris (Objenious/Sagemcom)
Asset management in urban environments faces several challenges: multipath environments, and typical non-line-of-sight propagation. Objenious and Sagemcom deployed a number of SiconiaTM positioning devices in the heart of Paris to track trucks. An alarm will be triggered when the truck leaves the designated area. Figure 5-12 shows the positioning terminal and gateway location and LoRaWAN positioning in downtown Paris.
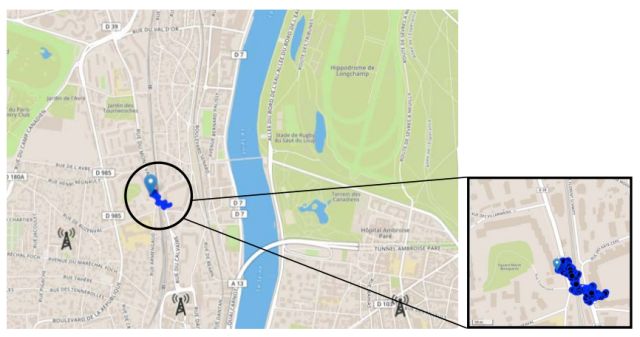
(Figure 5.12 Schematic diagram of truck positioning in the center of Paris)
The positioning key performance indicators (KPIs) of these positioning terminals are shown in Figure 5-13. CDF (first map) and probability distribution function of positioning accuracy (second graph) (average: 57m, std: 18m), and positioning error (third graph). Instantaneous station distance (ISD; fourth picture) is an indication of network density.
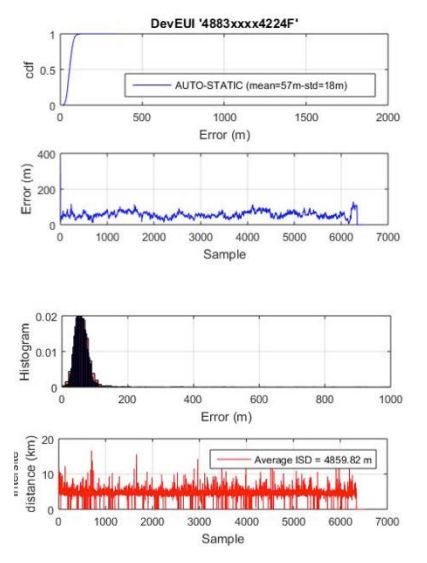
(Figure 5.13 Positioning Performance (CDF, ​​ISD), Paris City)
Figure 5-14 shows the instantaneous HDOP impact of network deployment on positioning accuracy. Before the gateway is deployed, the static GDOP should be evaluated as described in Section 4.3, and the gateway combinations available in the deployment area should be considered.
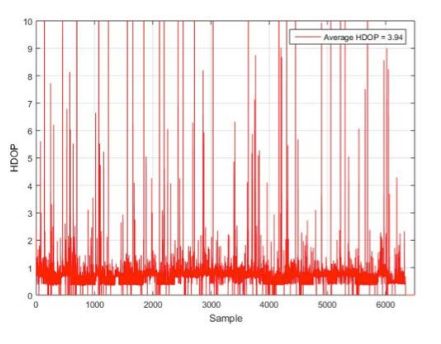
(Figure 5.14 Instantaneous HDOP Impact, Downtown Paris)
Figure 5-15 shows the GDOP obtained from a fixed terminal device (red) in the deployment area.
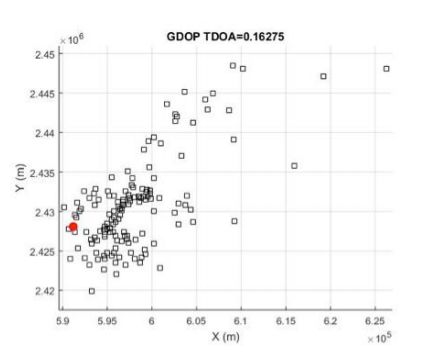
(Figure 5.15 A fixed terminal (red) in the case of gateway deployment
GDOP estimate)
For the same stationary terminal device, Figure 5-16 shows the relationship between the radio measurement environment (average RSS) of the terminal device and the distance between the terminal device and the base station. Obviously, in areas outside the corridor formed by dense gateways, the value of HDOP is much higher than the alignment with the gateway corridor.
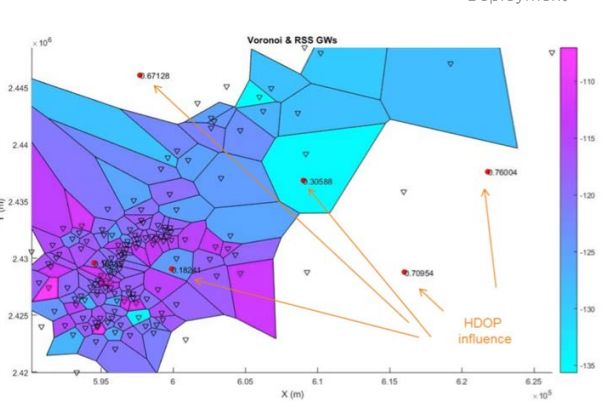
(Figure 5.16 HDOP Impact vs. Terminal to Base Station Distance)
7
Torinje Fueral (Kerlink/Semtech)
Kerlink provides location base stations in its Wirnet IBTS series supporting Location Based Services (LBS). These base stations provide accurate time stamps for positioning (using Semtech's protocol). A TDOA positioning solver has been developed and integrated into a proprietary LBS solution.
Kerlink has established several test platforms in various environments and conditions (rural, semi-urban, urban) around the world to evaluate and optimize the performance of the location solver, especially calculation accuracy and positioning accuracy. The test platform deployed in Torigne Fueral will continue to work, with four base stations installed in the city and multiple positioning terminals placed in planned fixed locations. When the location solver receives a near real-time message, it begins to calculate the location information and returns the result to the dashboard for display.
Figure 5.17 (a) Tornière Fuilal LoRaWAN Positioning Test Platform
(b) Estimated position of the stationary terminal
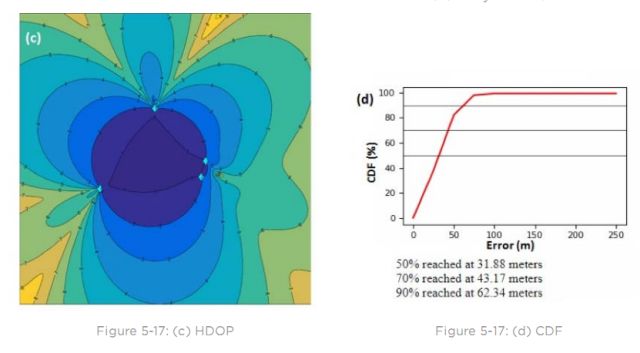
Figure 5.17 (c) HDOP (d) CDF
Figure 5-17(a) and (b) show the estimated locations of deployed networks and location terminals. The analysis of HDOP (Figure 5-17(c)) gives us a clearer understanding of the accuracy of the positioning. It should be noted here that the positioning information is processed using a Kalman filter. For a terminal CDF, as shown in Figure 5-17(d), the accuracy of 32 meters is 50%, 43 meters is 70% and 62 meters is 90%.
LoRaWAN positioning summary
The conclusion is as follows:
• LoRaWAN TDOA positioning provides positioning accuracy of 20 to 200 meters.
• One of the benefits of LoRaWAN positioning is the use of long-term, battery-powered Class A end devices, thus achieving zero additional BOM cost increases.
• Reduced multipath errors and good gateway deployment planning can increase positioning accuracy to 20 meters.
• LoRaWAN TDOA positioning is especially suitable for the following scenarios:
• Regional fences. Are fixed assets moved? (Anti-theft in construction sites, public places, airports, campuses, etc.)
• Tracking slow-moving assets without requiring frequent location updates (people, pets, livestock, vehicles, etc.), especially for smart agriculture and smart cities.
LoRaWAN TDOA positioning may not be suitable for the following scenarios:
• Real-time, mobile asset tracking. The higher the positioning frequency is, the more power is consumed, the C-type terminal, and so on.
• High dynamic asset positioning.
• High-precision positioning (Yami class, at least not using the current base station clock)
• The LoRaWAN protocol is used in use cases that require GPS function transfer.
Garmin Battery,Garmin GPS Battery,Garmin Nuvi Battery,Garmin Rechargeable Battery
Shenzhen Sunwind Energy Tech Co.,Ltd , https://www.sunwindbatterylm.com